Data Mining I
Topic outline
-
-
Important Dates
- Test #1: November 5th,
11:30-13:00 @ FC6 157 and FC6 16314:00-15:50 @ FC6 165 - Test #2: December 17th,
11:30-13:00 @ FC6 157 and FC6 16314:00-15:50 @ FC6 165 - Project Launch: September 25th
- Project Submission: December 11th (submissions allowed until December 11th @ 23:59)
- Project Presentation: December 13th (place and time to be announced)
- Test #1: November 5th,
-
Links to Data Mining books used in this course:
- A Gentle Introduction to Data Analytics
(João Moreira, André Carvalho, Tomáš Horváth)

-
-
-
-
-
-
-
-
-
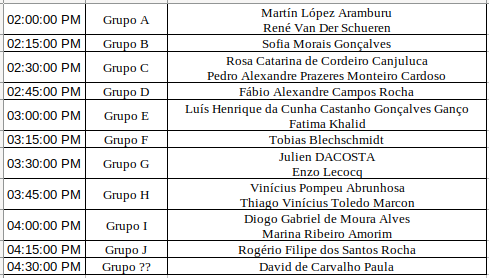
Presentations Dec 13th - 2:00-4:45pm, place: FC6 137 (S1)
-
Grades after Exam - normal season:

Results Exam: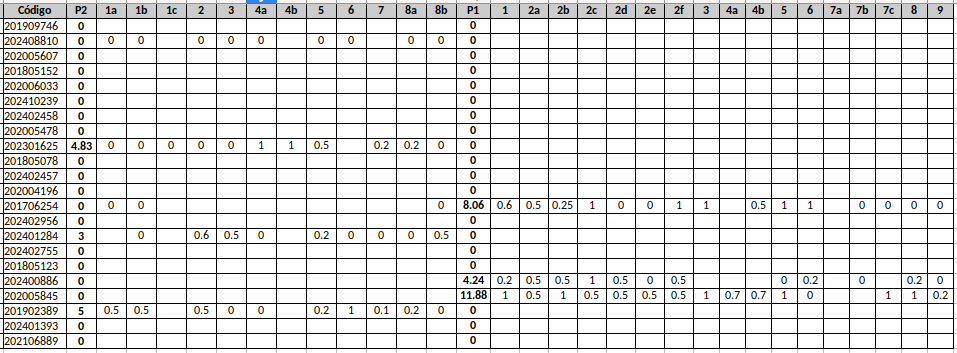
-
Comments and evaluation of homeworks and practical assignments: (max 1 point)

-
-
Paper: DataQuality and Integration Issues in Electronic Health Records
by: Ricardo João Cruz-Correia, Pedro Pereira Rodrigues, Alberto Freitas, Filipa Canario Almeida, Rong Chen, and Altamiro Costa-Pereira
- What are the main kinds of data errors discussed in this paper?
- Would it be possible to automatically identify and categorize those errors?
- What are
missing values?
- How missing values are categorized?
- What are the main methods used to handle missing values?
-
Read the three suggested papers and answer:
- What are the problems related with evaluating models in the context of cross-validation? Discuss about micro-averaging and macro-averaging and their impact in the evaluation of corss-validated models.
- What is the relationship between ROC and PR curves? Why the second paper argues that ROC produces overly optimistic results when the class is imbalanced?
- What is the argument of paper #3 when saying that it is OK to use ROC with imbalanced classes?
-
-
-
Week #1 (Sep 24th)
-
-
-
Week #2 (Oct 1st)
-
-
Week #3 (Oct 8th)
-
-
Week #4 (Oct 15th)
-
-
Week #5 (Oct 22nd)
-
-
-
-
Week #6 (Oct 31st)
NO CLASS (FCUP activities)
-
Week #7 (Nov 5th)
- Basic Concepts in Classification
- Review for TEST #1
-
-
Week #8 (Nov 12th)
-
-
-
Week #9 (Nov 19th)
-
-
-
-
Week #10 (Nov 26th)
-
-
-
Week #11 (Dec 3rd)
-
-
-
-
-
Section 2.6.1.4 of this dissertation has a detailed and nice explanation about SVMs.
-
-
Week #12 (Dec 10th)
Clustering
-
-
Week #13 (Dec 17th)
Review for Test #2
-
-
-
-
-
Week #1: Introduction to Pandas
Our first practice will be an introduction to Pandas, a Python library for data pre-processing and data analysis that can be found here. Before you start this tutorial, it may be helpful to have a version of Python installed and get used with the interface, if you do not wish to use Colab notebooks.
In this class, we will follow exercises 01 to 09. Don't worry if you can not finish all exercises during class. You will be able to revisit them in future classes.
-
Week #2: Exploring a dataset
- This is a colab notebook where you will have a chance of practicing data exploration with pandas.
- This is a colab notebook where you will have a chance of practicing data exploration with pandas.
-
Week #3: Distances, correlation, entropy, mutual information
- This is a colab notebook where you will have a chance of practicing with the various distance calculations either implementing them yourself or using implementations found in Python libraries.
Some questions you should answer:- Give examples of suitable domains to apply Euclidean, Minkowski, Mahalanobis and Cosine distances
- What is the advantage of using each one of these distances?
- Why is it convenient to normalize data when calculating distances?
- Which distances are sensitive to non-normalized data?
- What is Bray-Curtis distance and what is it good for?
- What is the meaning and utility of a distance between:
- two objects?
- two features?
- What is the difference between distances, correlation, entropy and mutual information?
A good guide to the use of correlation between variables of different types: https://datascientest.com/en/calculate-correlation-between-two-variables-how-do-you-measure-dependence -
Week #4: Data Visualization, sampling, dimensionality reduction, data imputation, data transformation
Some questions you should answer:- Why is it necessary to reduce the dimension of the data? What does it mean?
- Is it always convenient to impute missing data? Give examples when it is not convenient to impute missing data.
- What is the objective of a pairplot?
- What is a boxplot and when should be used?
- Discuss about different ways of transforming data: discretization (various ways), binarization, label encoding etc.
- Why is it necessary to reduce the dimension of the data? What does it mean?
-
Week #5: Data Visualization, sampling, dimensionality reduction, data imputation, data transformation
(continuation of previous week with focus on data imputation and data visualization)
Some questions you should answer:- Why is it necessary to reduce the dimension of the data? What does it mean?
- Is it always convenient to impute missing data? Give examples when it is not convenient to impute missing data.
- What is the objective of a pairplot?
- What is a boxplot and when should be used?
- Discuss about different ways of transforming data: discretization (various ways), binarization, label encoding etc.
- Why is it necessary to reduce the dimension of the data? What does it mean?
-
-
-
-
Week #6:
NO CLASS (FCUP activities) -
Week #7:
TEST #1 -
Week #8:
Decision Trees
- Apply the Python DecisionTreeClassifier to the iris dataset
- Use Decision Trees on the German credit dataset.
- What is the misclassification error of DT on the training data?
- Take one example and explain how the DT obtains the classification.
- Plot the tree.
- Try different pruning approaches, obtaining trees from 1 node to maximum size.
- Try to identify the possible cutpoints of the
durationattribute.
Naive BayesRepeat the same steps above, now using a naive Bayes classifier. For the iris dataset, you will need to discretize the variables. For the German credit dataset you have three options: train with only categorical features, train with only numerical features or all. For each one you need to use a different Python package (see corresponding notebook below).
-
Week #9:
Intermediate assignment presentation.
-
Week #10: Decision Boundaries and Performance Evaluation of Classifiers
-
Week #11: Regression and SVMs
-
Week #12: Clustering and Ensemble models
-
Here it is some Python code applying hierarchical clustering to the iris dataset.
Explore the various options of clustering, including k-means, k-means++ and dbscan. Identify differences between these different clustering methods.
Apply these methods and evaluate the quality of the generated clusters using your favorite dataset.
-
Week #13:
TEST #2
-
Subjects:
- Machine learning concepts. Supervised and unsupervised learning
- Classification: Decision trees, Logistic Regression, SVMs, Bayesian networks, Neural Networks
- Regression: linear and ridge regression, regularization
- Evaluation metrics for classification and regression
- Model validation
- Clustering analysis
-
Grades of Test #2

-


